A Sun more complex than expected
A Sun more complex than expected
Created at
Description
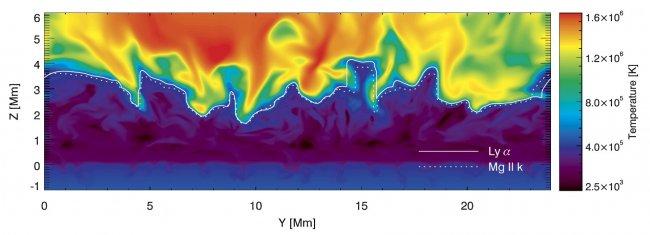
Figure 1: Visualization of the temperature structure across a vertical slice through a three-dimensional (3D) model of the solar atmosphere, taken from a state-of-the-art magneto-hydrodynamic simulation of the chromosphere-corona transition region (see Carlsson et al. 2016; A&A, 585, A4). The solid curve shows the heights (Z) in this model where the line-center photons of the hydrogen Lyman-α line observed by CLASP stem from (note that it practically delineates the model’s transition region). The investigation summarized in this press release demonstrates that in the true solar atmosphere the geometry of the transition region is much more complex. For more details see Trujillo Bueno and the CLASP team (2018; The Astrophysical Journal Letters, 866, L15).